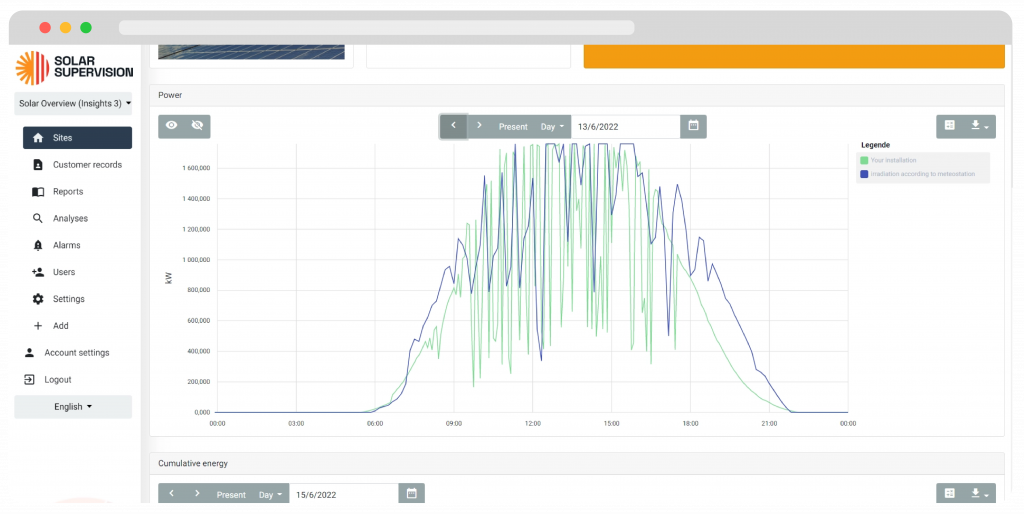
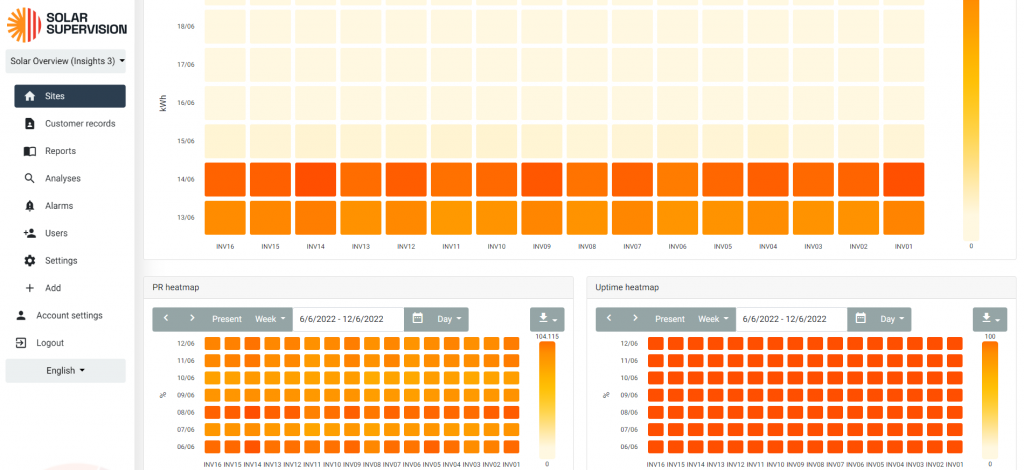
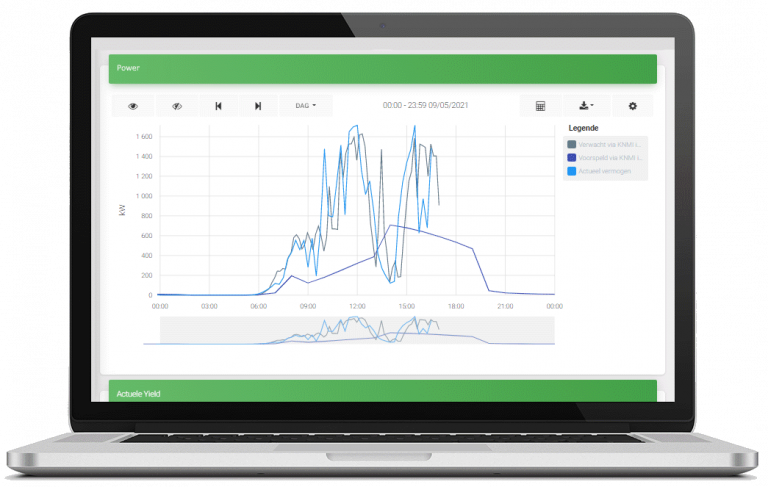
Performance ratio’s are calculated by comparing the average yield with the expected yield. This expected yield is carefully calculated using various factors, such as the type of inverter, location, weather data and more.
Energy Performance Index (EPI) is the key metric used for benchmarking energy usage in residential and commercial buildings. EPI is the energy used per unit area measured as kWh/m2/year or kWh/person/year.
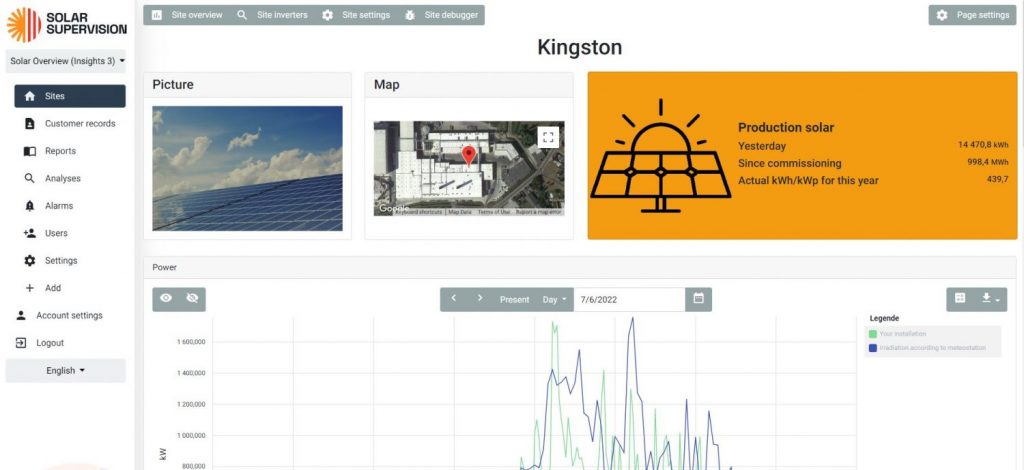
Compare performance with the weather data for each location: sun duration, irradiation.
Performance in perspective
Performance ratio linked to pyranometers or weather stations.
Production predictions based on irradiation forecasts.
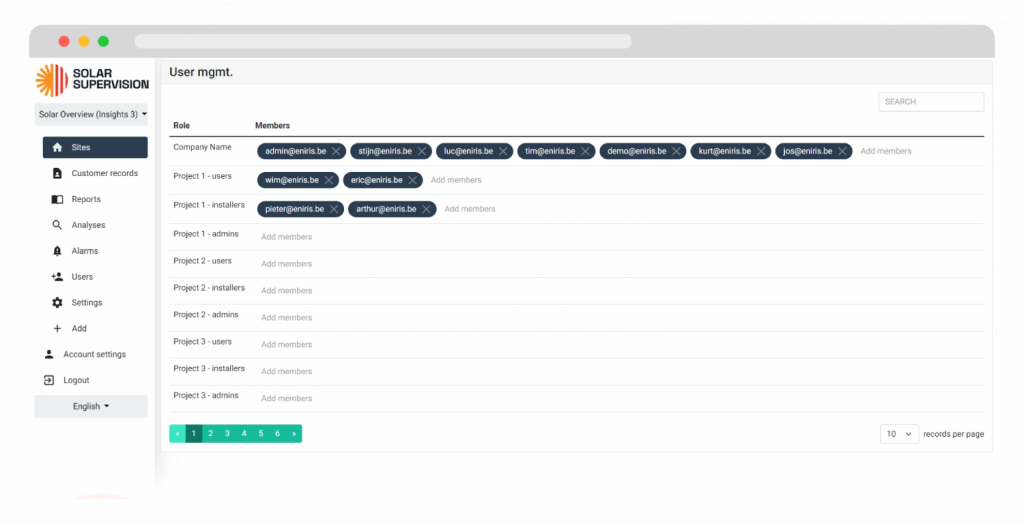
User Management
Managing access was never this simple.
Access for different types of users
With Solar Supervision you can manage and add your customers, technicians and admins in a user friendly manner.
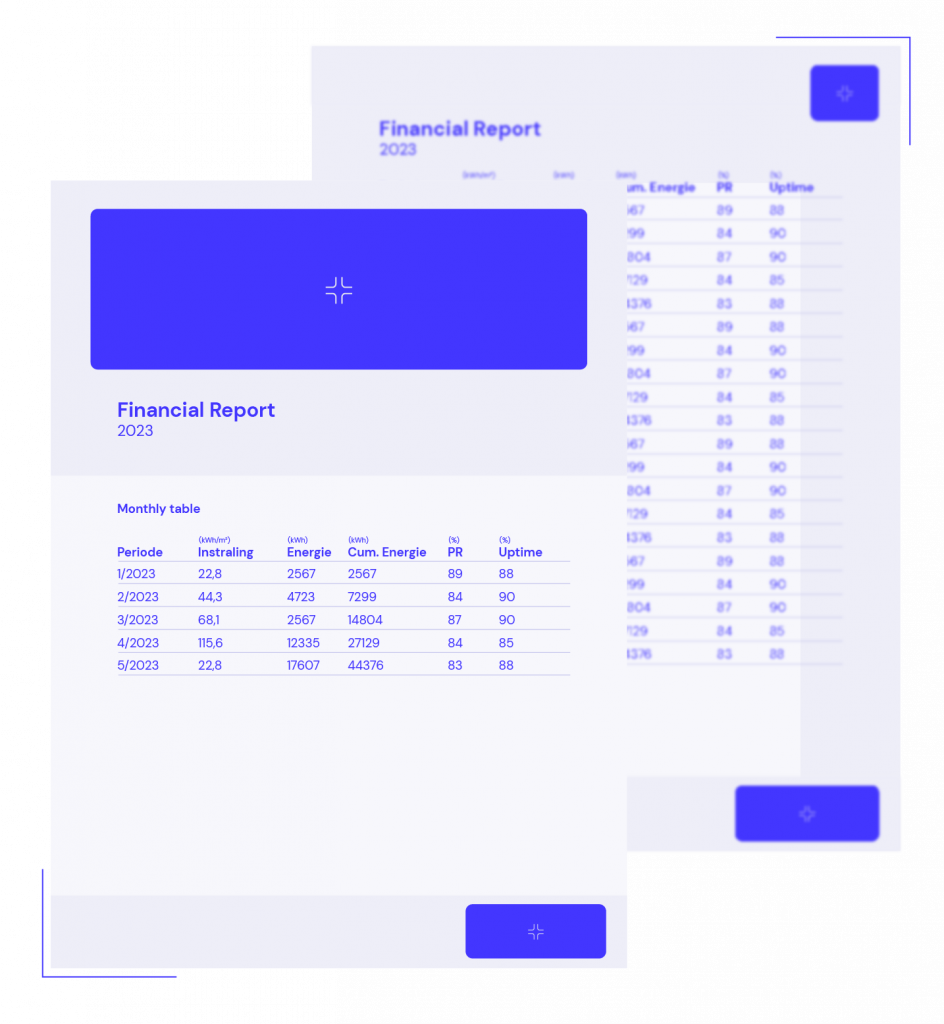
Automatic reporting
Managing access was never this simple.
Access for different types of users
With Solar Supervision you can manage and add your customers, technicians and admins in a user friendly manner.
Automatic reporting
Managing access was never this simple.
Bye bye spreadsheets
Yield, financial or group reporting. For internal or external use.
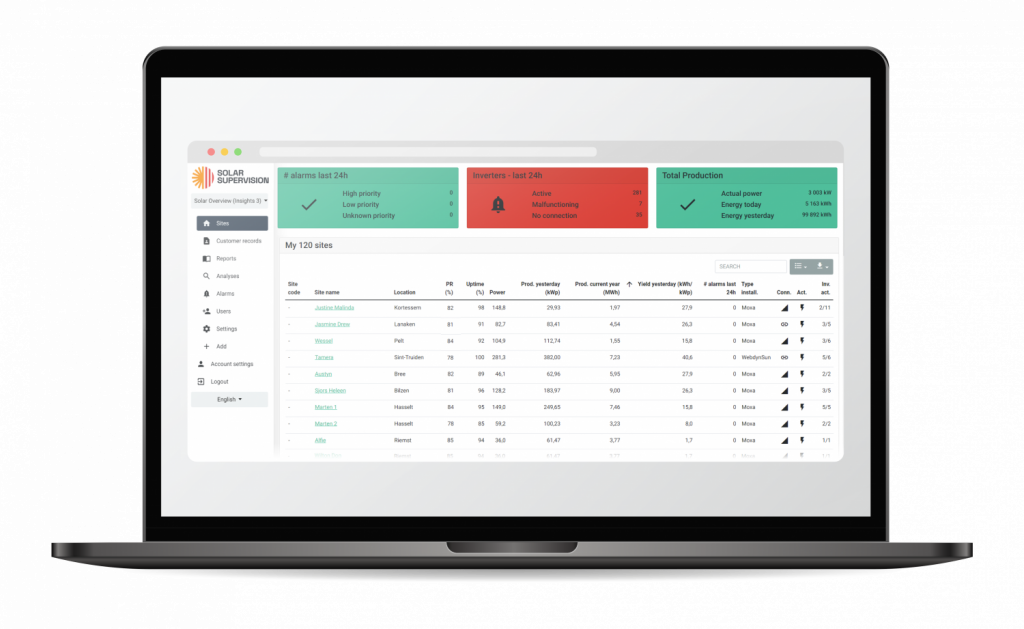
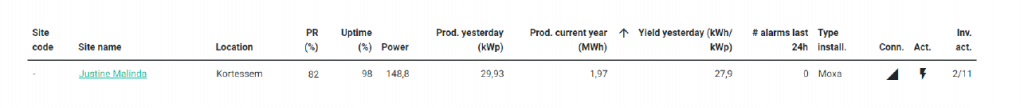
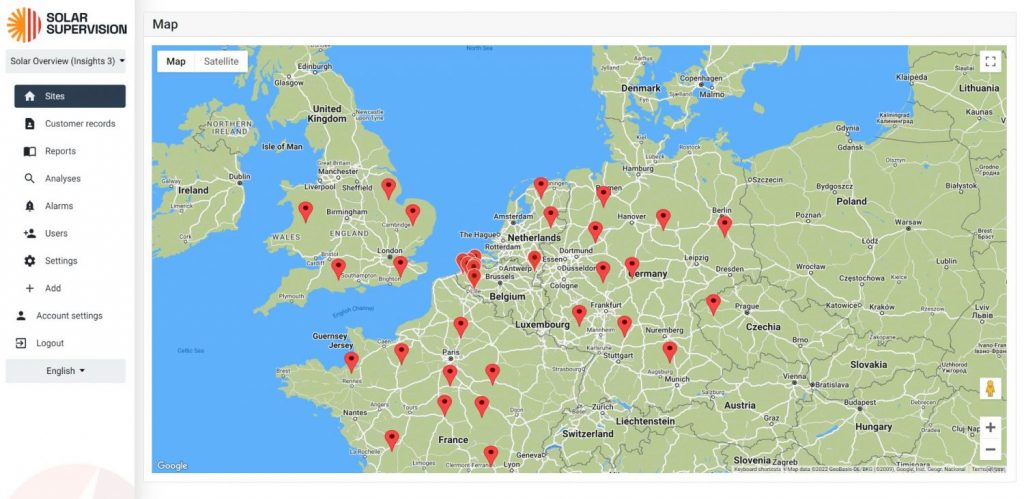
Detect the weakest link
Tracking down problems within your portfolio is extremely easy thanks to our analyses.
Interactive live maps
A quick overview of the poorly performing installations.
Follow up down to the last detail (string, optimiser, …)
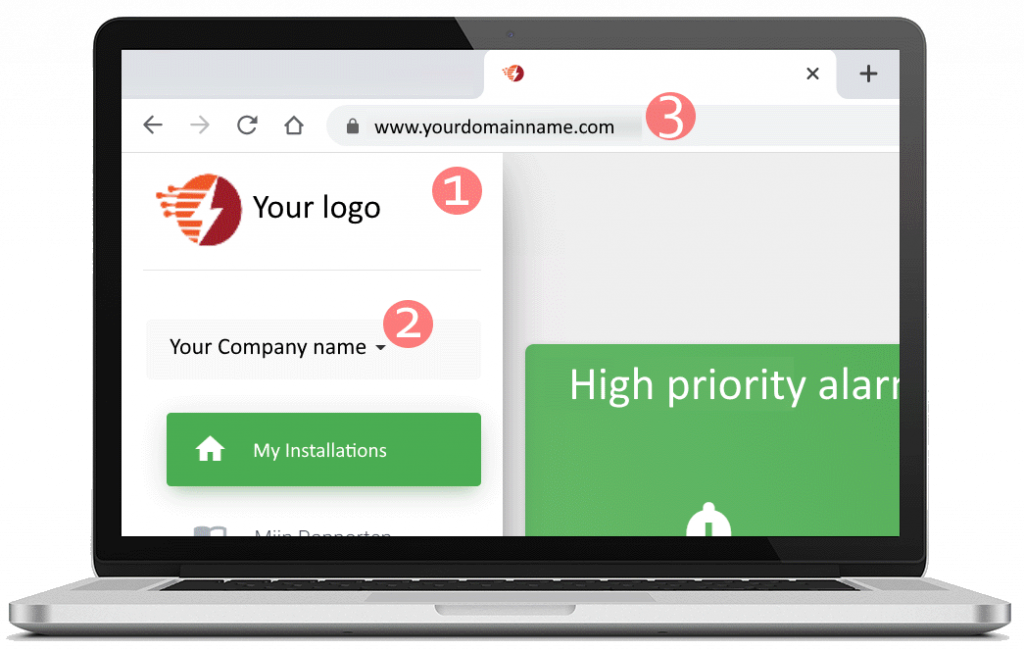
White label Monitoring
Your brand logo on our platform.
Strenghten your brand
A platform completely according to your corporate identity and part of your own ecosystem.
Your logos
Accessible via your URL
Color scheme in accordance with your corporate identity.
Combined view
Combine inverters from different brands and pour them all together in 1 central view.
Uniform system pages
Leave comments for your staff or the end customer.
Visualise energy consumption registered by energy meters.
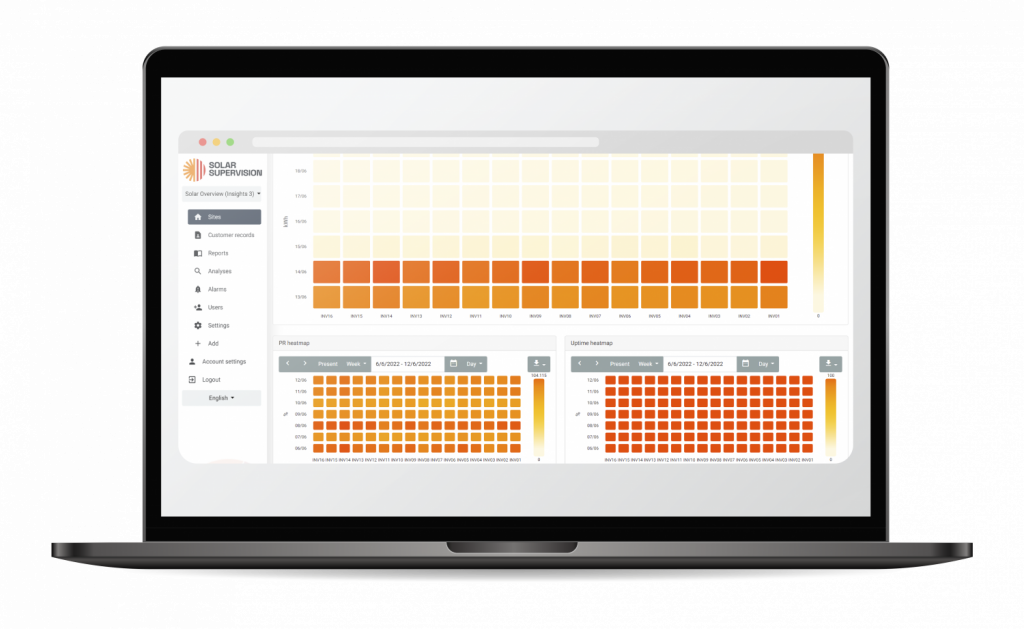
Indispensible Analytics
A fast visual check or a detailed comparison, Solar Supervision provides nifty tools.
From data to decisions
Compare on string & inverter level
Compare sensors and energy meters
Financial, technical and maintenance analytics
Various visualisations (heatmap, piecharts, barcharts, scatter plots…).
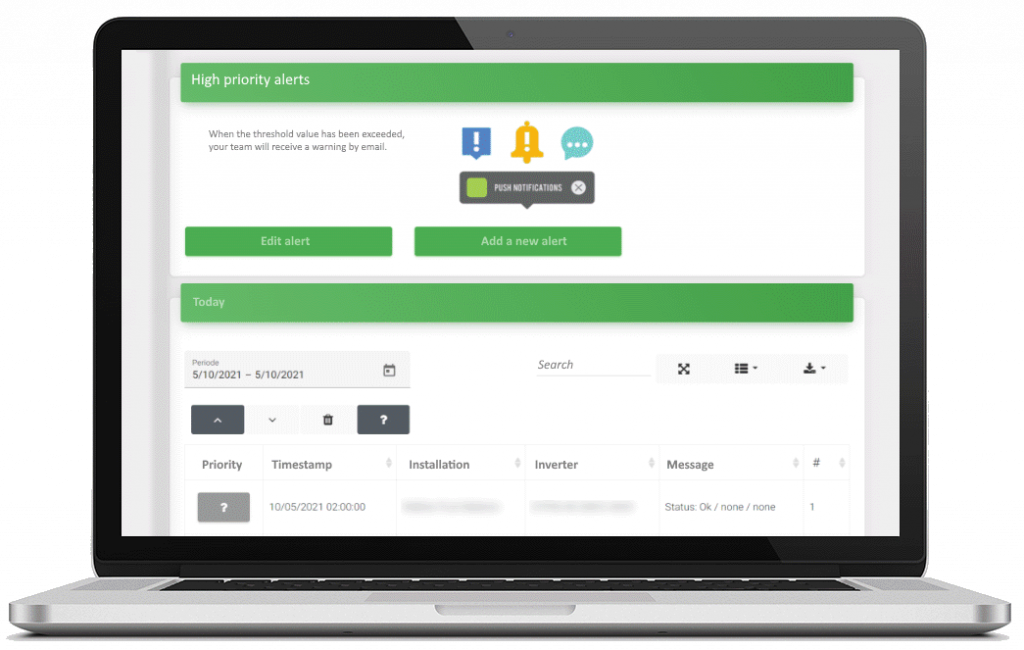
Alarm Management and Ticketing
Set your own alarm thresholds independent from the supporting portals.
More efficiency from alarm processing
Overarching registration & processing
Allocating diverse priorities
Send alarms by email, pop-up, or text message
Integration with your ERP-system/digital work orders
Ticketing within Solar Supervision
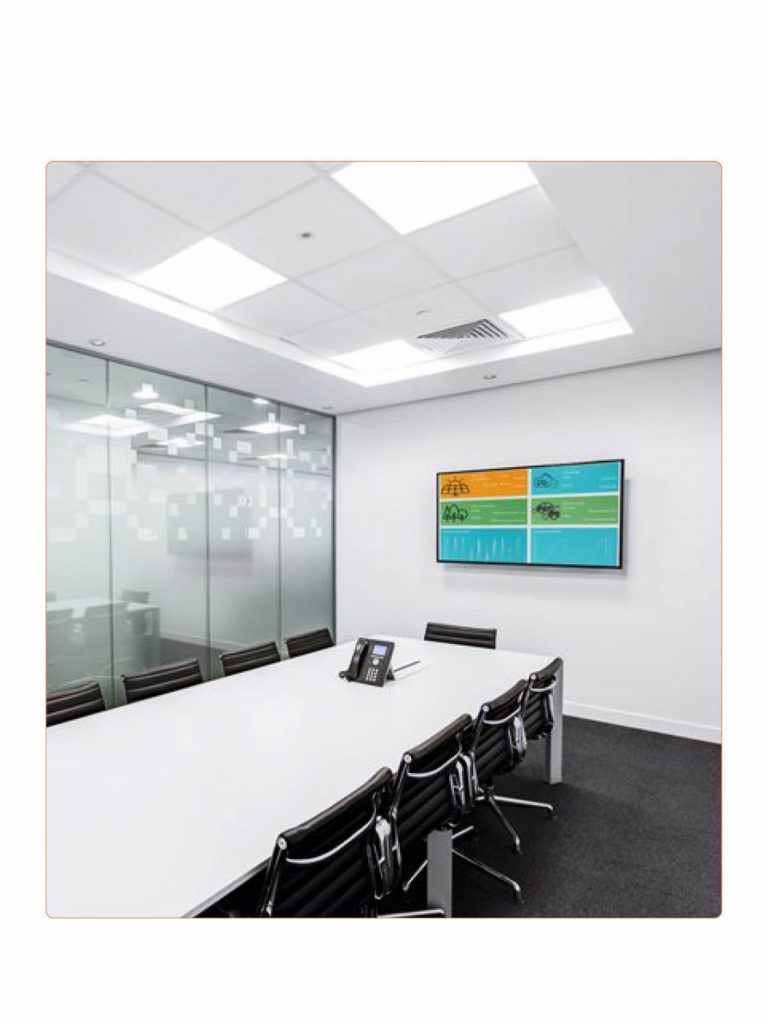
Infographics
Share production numbers with the wider public through infographics.
Narrowcasting solutions
Fight climate change and show off your efforts with real time performance data:
CO2-reduction
Savings measures
Current production
…
Everything centralised in no time
Get started fast with a minimum of effort. We provide you with FTP credentials or you provide us with a guestaccount from the portals of the inverters that you wish to monitor.
Complementary Products
Solar Gateway
With Solar Supervision we can read & control inverters without the need to purchase and install additional hardware – if they are already connected to a platform (e.g. Sunny Portal). We collect the data and alarms through the API’s.
In case inverters don’t link up with an already existing platform, we can read and collect data via Modbus through our very own Solar Gateway. This allows you to enjoy detailed monitoring, eventhough your employed inverters are not IoT or cloud supported.
For all energy sectors
Asset Managers
Manage your solar portfolio in one go. A single platform to centralise your data and analytics. Facitilitate your operations and maintentance with alarm management and automated periodical reporting.
Energy Cooperatives & Investors
Involve your stakeholders in the technical and financial performance of the solar plants or show the impact of sustainable investments to the general public through Solar Supervision.
EPC & Installers
Solar Supervision as an overarching platform for the management of your energy systems: solar panels, cogeneration, heating and cooling, HVAC, swimming pools, energy meters, and much more.